
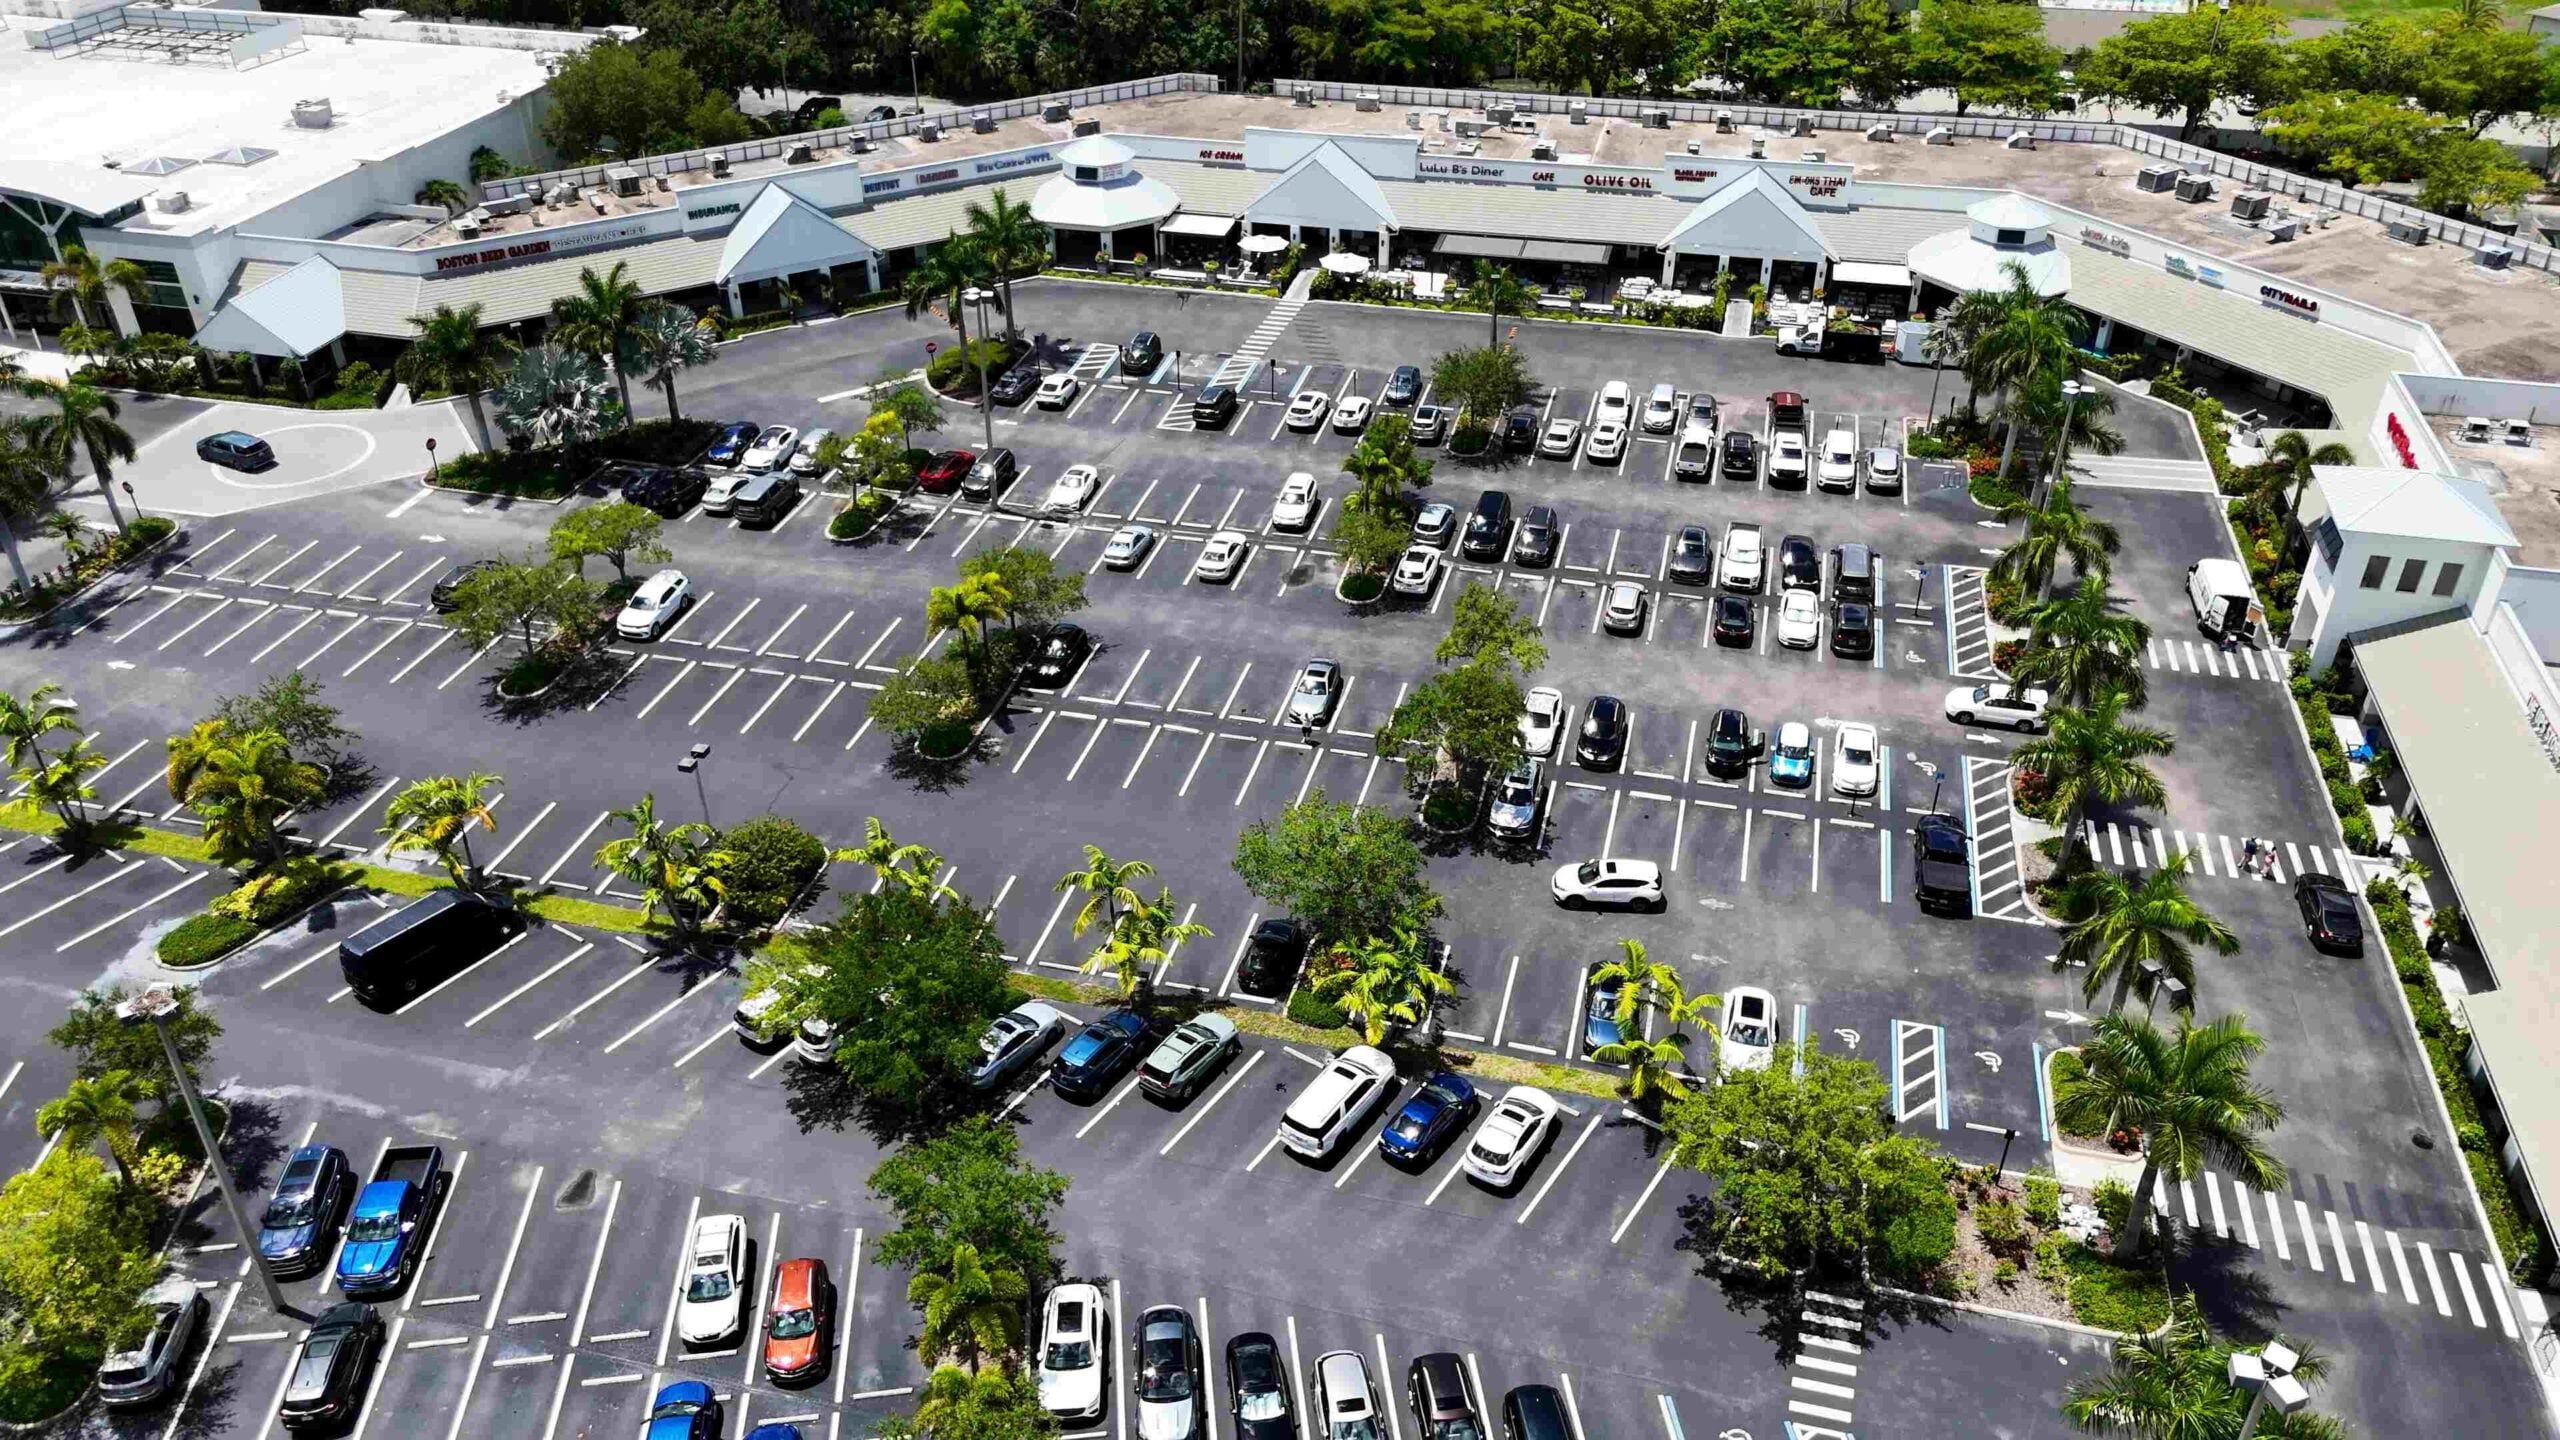
The lot held 80 used units. Average days-to-turn sat at 58. Twelve trucks had aged past 70 days, each carrying at least $2,450 in holding cost at $35 per day.
We analyzed three stores, 180 retail sales and 90 days of inventory activity. Five dealer inventory mix 2026 changes lowered average turn from 58 days to 44 days.
The 14-day reduction saved $490 in holding cost per unit. Front gross increased $300 across the full 180-unit sample. The 60-unit post-change monthly cohort improved about $350 per unit.
The stores did not buy more inventory. They changed which price bands, body styles and fuel types received the open purchase slots.
Five Inventory Mix Changes Across 180 Used Sales
| # | Inventory Mix Change | Before Mix | After Mix | Days Saved by Segment | Segment Turn | Gross Change | Why the Segment Improved |
| 1 | Cut trucks priced above $25,000 from 30% to 15% | 24 of 80 units, 70-day turn | 12 of 80 units, 45-day turn | 25 days | 70 to 45 days | +$200 | The stores held more trucks than qualified local demand supported |
| 2 | Increase $15,000 to $22,000 SUVs from 25% to 40% | 20 of 80 units, 38-day turn | 32 of 80 units, 32-day turn | 6 days | 38 to 32 days | +$400 | This band produced more VDP activity, leads and appointments |
| 3 | Increase three-year-old off-lease sedans from 10% to 20% | 8 of 80 units, 52-day turn | 16 of 80 units, 35-day turn | 17 days | 52 to 35 days | +$350 | The $12,000 to $18,000 band matched first-time and commuter demand |
| 4 | Cut vehicles priced below $8,000 from 15% to 5% | 12 of 80 units, 65-day turn and $1,500 recon | 4 of 80 units, 40-day turn | 25 days | 65 to 40 days | +$500 | Recon consumed too much of the available gross |
| 5 | Increase hybrids from 5% to 12% | 4 of 80 units, 30-day turn | About 10 of 80 units, 28-day turn | 2 days | 30 to 28 days | +$300 | Local hybrid searches rose 40% during the test period |
| Total | Five mix changes over 90 days | 58-day average turn | 44-day average turn | 14 days overall | 6.3 to 8.3 annualized turns | +$350 in the post-change cohort | $490 less holding cost per sold unit |
This is a three-store operating result, not a national mix benchmark. Your correct percentages depend on local demand, acquisition cost, season, credit mix, recon capacity and lead volume.
The segment improvements also overlap. Do not add 25 truck days, six SUV days and 17 sedan days. The overall sold-inventory average fell by 14 days.
#1 and #2: Fewer $25,000 Trucks and More $15,000 to $22,000 SUVs
Trucks represented 30% of the original 80-unit inventory. Twenty-four trucks occupied the lot, and 12 had aged past 70 days.
The issue was not truck demand. The stores owned too many similar trucks above $25,000 at the same time.
Several competed within the same mileage, payment and equipment range. Price reductions moved one truck while leaving the rest exposed to another week of interest and depreciation.
The stores cut high-price truck inventory to 15%, or 12 units on an 80-unit lot. Average truck turn fell from 70 days to 45 days.
Removing 12 trucks priced at $25,000 or more also released at least $300,000 in inventory capital:
12 trucks × $25,000 = $300,000
The open slots moved into SUVs priced from $15,000 to $22,000. SUV share increased from 25% to 40%, equal to 12 additional units on an 80-unit lot.
SUV days-to-turn fell from 38 to 32 days despite the larger count. The segment had enough lead activity to support the added depth.
Payment examples at the stores placed many SUVs in the $320 to $410 range with approved credit and the stated term and down payment. Comparable trucks often reached $550 or more under the same store assumptions.
Those payment figures are illustrations, not universal quotes. APR, term, taxes, down payment and credit tier change the result.
The buy sheet began tracking six fields for every segment:
- Units in stock
- Units sold during the prior 30 days
- Average days-to-turn
- VDP views per unit
- Leads per unit
- Average front gross
A body style with 20 units in stock and six monthly sales has more than three months of supply. Another purchase belongs in a different segment unless a specific shortage supports the buy.
Action: Cap trucks above $25,000 at 15% until 30-day sales and lead activity support more inventory. Move the available purchase slots into proven SUV price bands.
#3: Three-Year-Old Off-Lease Sedans Cut 17 Days
Sedans represented 10% of the original mix. Most units sat outside the strongest price and age range.
The stores shifted toward three-year-old off-lease sedans priced between $12,000 and $18,000. Sedan share increased from 10% to 20%, or from eight units to 16 on an 80-unit lot.
Average sedan turn fell from 52 days to 35 days. Front gross increased about $350 per unit.
The successful units shared several traits:
- Documented service history
- One-owner or fleet-maintained records
- Predictable recon
- Modern safety equipment
- Payment below larger SUVs and trucks
Age alone did not make the vehicle desirable. A three-year-old sedan with poor tires, accident history and a $2,000 recon estimate still missed the buy standard.
The UCM added a maximum acquisition cost for each model and mileage band. The store also estimated recon before confirming the purchase.
For example:
Expected retail price: $17,500
Target front gross: $2,500
Recon allowance: $900
Holding and selling expense: $600
Maximum acquisition cost: $13,500
The calculation stopped the desk from paying SUV money for a sedan with weaker resale demand.
Off-lease supply also gave the stores a narrower range of years and equipment. Merchandising became easier because shoppers saw clear differences in mileage, trim and price.
Action: Reserve 20% of the lot for proven $12,000 to $18,000 sedans. Set model-specific buy limits before entering the lane or making a lease-return offer.
#4: Cutting Sub-$8,000 Cars Protected $500 in Gross
Vehicles priced below $8,000 represented 15% of the old inventory. The UCM viewed them as affordable traffic units.
The repair orders showed a different result.
Average recon reached $1,500. That expense equaled 18.75% of an $8,000 retail price before advertising, commissions, interest or price reductions.
Many units also needed more shop time. Older vehicles waited for parts, failed secondary inspections or returned to the shop after the first repair.
Average turn reached 65 days.
The stores reduced this segment from 15% to 5%. The remaining units came from known local trades with service records and manageable recon.
Turn fell to 40 days. Gross improved about $500 per unit inside the segment.
The rule did not ban every inexpensive car. It blocked auction purchases and unknown street buys with thin margin and high mechanical exposure.
A sub-$8,000 unit needed all four approvals:
- Clean title and acceptable history
- Completed inspection before final value
- Recon below the store cap
- A realistic retail price with room for gross
Units missing one approval moved to wholesale.
Action: Keep sub-$8,000 inventory near 5% unless your store has dedicated technicians, parts access and proven demand for older vehicles.
#5: Hybrids Grew From 5% to 12%
Hybrids represented 5% of the original mix, equal to four units on an 80-unit lot.
During the 90-day review, local hybrid search activity rose 40% in the stores’ website data. Local fuel prices averaged about $3.80 during the measured period.
The stores raised hybrid inventory to 12%, or about 10 units. Average hybrid turn moved from 30 days to 28 days, and gross increased about $300.
A two-day improvement looks small beside the truck result. The value came from adding six units without increasing segment age.
The store did not buy every hybrid offered. The appraisal sheet required:
- Battery and hybrid-system scan
- Remaining warranty review
- Service-history check
- Model-specific demand
- Recon allowance
- Comparable retail supply
Hybrid pricing also stayed model-specific. A RAV4 Hybrid, Accord Hybrid and high-mileage luxury hybrid did not share one demand curve.
Action: Increase hybrid share only where SRP searches, VDP activity and 30-day sales support the added count.
Real Mix Shift: How One Dealer Cut Turn From 58 to 44 Days
“One Toyota store cut $25K+ trucks and added $15-22K SUVs + hybrids via Cardealerships.com listing mix data, turn dropped 58 to 44 days in 90 days.”
“UCM said: ‘We stopped buying what we liked, we bought what turned.’”
“Holding saved $490/unit x 60 units = $29,400.”
Mix Math: 14 Fewer Days Produced an $840 Per-Unit Improvement
The post-change monthly cohort averaged 60 sold units.
14 days saved × $35 daily holding cost = $490 saved per unit.
$490 holding savings + $350 front-gross improvement = $840 per unit.
$840 × 60 sold units = $50,400 in monthly benefit.
Annualized simple turns also improved:
365 ÷ 58 days = 6.3 turns per year.
365 ÷ 44 days = 8.3 turns per year.
This annualized calculation measures days-to-turn. It is separate from the accounting inventory-turn calculation based on cost of sales and average inventory investment.
The full 180-unit sample gained $300 in front gross per unit. The later 60-unit cohort gained about $350 after the new mix reached its target percentages. That difference explains the two gross figures.
Your Monday inventory board should show:
- Current unit count by body style
- Unit count by retail price band
- Sales during the prior 30 days
- Days-to-turn by segment
- Front gross by segment
- VDP views and leads per unit
- Recon by segment
- Open purchase slots
A purchase slot should open only after the board identifies a shortage. “Good car” is not enough. The unit needs a place in the mix, a price-band target and a turn expectation.
Related: 6 Trade-In Acquisition Trends Adding 12 Used Units a Month
Related: 8 Recon Bottlenecks Costing $175 Per Unit
Sponsored by Gas.net — powering dealership growth through intelligent data.
Alt text: “Gas.net connects franchise dealers with integrated analytics and marketing tools.”